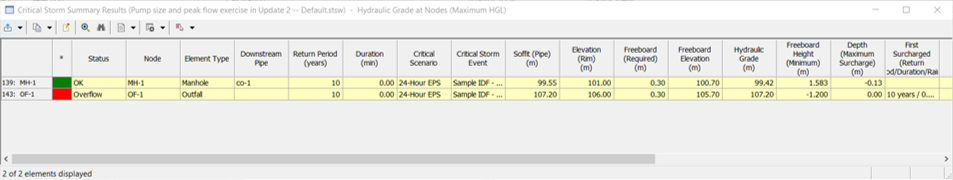
Critical Storm Summary Results Table
Once the critical storm analysis is complete, this table displays the results of the analysis.
On the right-click context menu of any column, you can use "Dendritic Sort (Upstream -> Downstream)". This is the same sort option found in FlexTables.


There are several available columns in the table. These vary slightly, depending on the Analysis Type selected. By default, all columns are available in the table. You can modify which columns are included by using the Edit button in the toolbar. The available columns are as follows:
- * - this column shows the status of the node or conduit.
- Status - either OK, Surcharged, Overflow Risk, or Overflow. See the Critical Storm Analysis section to see how each status is determined
- Critical Scenario - this is the label of the critical scenario for this node or conduit
- Critical Storm Event - this is the storm event assigned to the scenario in the rainfall runoff alternative
- First Surcharge (Return Period/Duration/ Rainfall Curve) - this is the label of the first scenario that surcharged for this element. The format is return period/duration/profile.
- Flow / Capacity - this is the ratio of the maximum flow over the full flow capacity
- First Overflow (Return Period/Duration/Rainfall Curve) - this is the label of the first scenario that overflowed for this node. The format is return period/duration/profile.
- Volume (Pipe, Discharge) - the total pipe volume out of the downstream pipe of the node or in the conduit
- Velocity (Pipe, Maximum) - the maximum velocity of the downstream pipe or in the conduit
- Flow (Pipe, Maximum) - the maximum flow in the downstream pipe or in the conduit
Columns that are specific to Hydraulic Grade Line at Nodes:
- Node - this is the label of the node analyzed
- Element Type - the type of node - i.e. Manhole, Catch Basin, etc.
- Downstream Pipe - this is the label of the downstream pipe connected to the node
- Soffit (Pipe) - this is the soffit of the downstream pipe
- Elevation (Rim) - this is the rim elevation of the node
- Freeboard (Required) - the required depth below the rim elevation that is used to determine the lower limit of the overflow risk status
- Freeboard Elevation - this is the rim elevation of the node minus the freeboard depth
- Freeboard Height (Minimum) - this is minimum distance of the Hydraulic Grade below the Elevation (Rim) for the critical scenario. This value will be negative if the element is flooded
- Hydraulic Grade - this is the maximum, median, or mean hydraulic grade of the node for the critical scenario
- Depth (Surcharge) - this is the derived surcharge depth of the node for the critical scenario. The surcharge depth is the difference between the maximum hydraulic grade and the pipe soffit
- Flow (Maximum Overflow) - the maximum overflow at the node for the critical scenario
- Volume (Overflow) - the total volume of overflow coming out of the node for the critical scenario
Columns that are specific to Flow in Conduits:
- Conduit - this is the label of the conduit analyzed
- Element Type - Closed Section, Open Section, or Culvert
- Node (Upstream) - this is the label of the upstream node connected to the conduit
- Rise (Conduit) - the rise of the conduit, which is the diameter for a circular section
- Invert (Start) - the invert at the start of the conduit
- Soffit (Start) - the soffit at the start of the conduit. Calculated by adding the Rise to the Invert
- Conduit Freeboard (Start) - the freeboard at the start of the conduit. Calculated by deducting the Conduit Freeboard (in Options) from the Elevation Ground (Start)
- Elevation Ground (Start) - The ground elevation at the start of the conduit
- Hydraulic Grade (In) - The Hydraulic Grade Line at the start of the conduit
- Invert (Stop) - the invert at the stop of the conduit
- Soffit (Stop) - the soffit at the stop of the conduit. Calculated by adding the Rise to the Invert
- Conduit Freeboard (Stop) - the freeboard at the stop of the conduit. Calculated by deducting the Conduit Freeboard (in Options) from the Elevation Ground (Stop)
- Elevation Ground (Stop) - The ground elevation at the stop of the conduit
- Hydraulic Grade (Out) - The Hydraulic Grade Line at the stop of the conduit
- Flow - this is the maximum, median, or mean flow in the conduit for the critical scenario
Once the Critical Storm Table is closed, in order to re-open it, the user must rerun the critical storm analysis.